📌 TL;DR
Stock volume shows how much trading activity is happening in the market.
By learning how to read volume in stock trading,
you can tell whether a price move is strong or weak.
💡 Introduction
Many beginner traders focus only on price.
But price alone does not tell the full story.
A stock can rise quickly and still be weak.
It can fall and still be preparing for a strong reversal.
The key to understanding this difference is volume.
If you learn how to read volume in stock trading,
you will start to see what most beginners miss —
whether the market move is real or fake.
Understanding how to read volume in stock trading
is one of the most important skills for beginner traders.
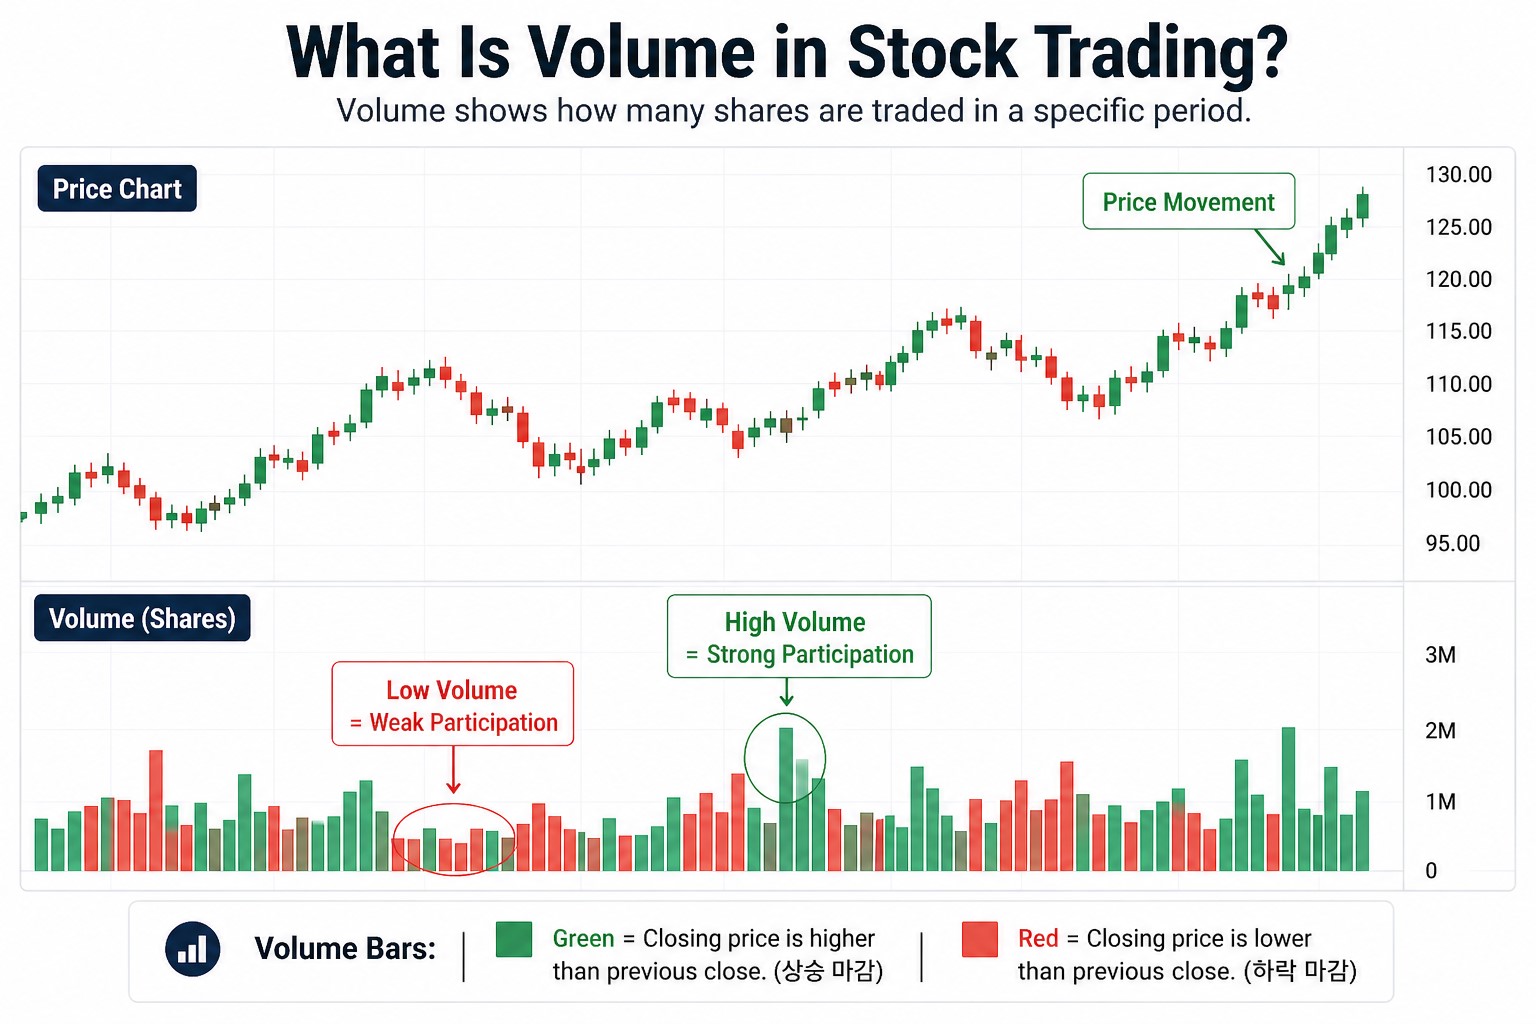
📊 1. What Is Volume in Stock Trading?
👉 For a deeper explanation, you can refer to Investopedia’s guide on trading volume.
Volume refers to the number of shares traded during a specific period. For example:
- High volume = Many traders are participating
- Low volume = Weak participation
Volume is usually displayed as bars at the bottom of a chart. It does not predict price direction, but it confirms the strength of the move.
🔥 2. Why Volume Matters More Than Price
Price shows what is happening. Volume shows the strength behind the move. Here’s a simple rule:
- Rising price + high volume → Strong move (Conviction)
- Rising price + low volume → Weak move (Lack of interest)
- Falling price + high volume → Strong selling pressure
This is why professional traders always look at volume first.
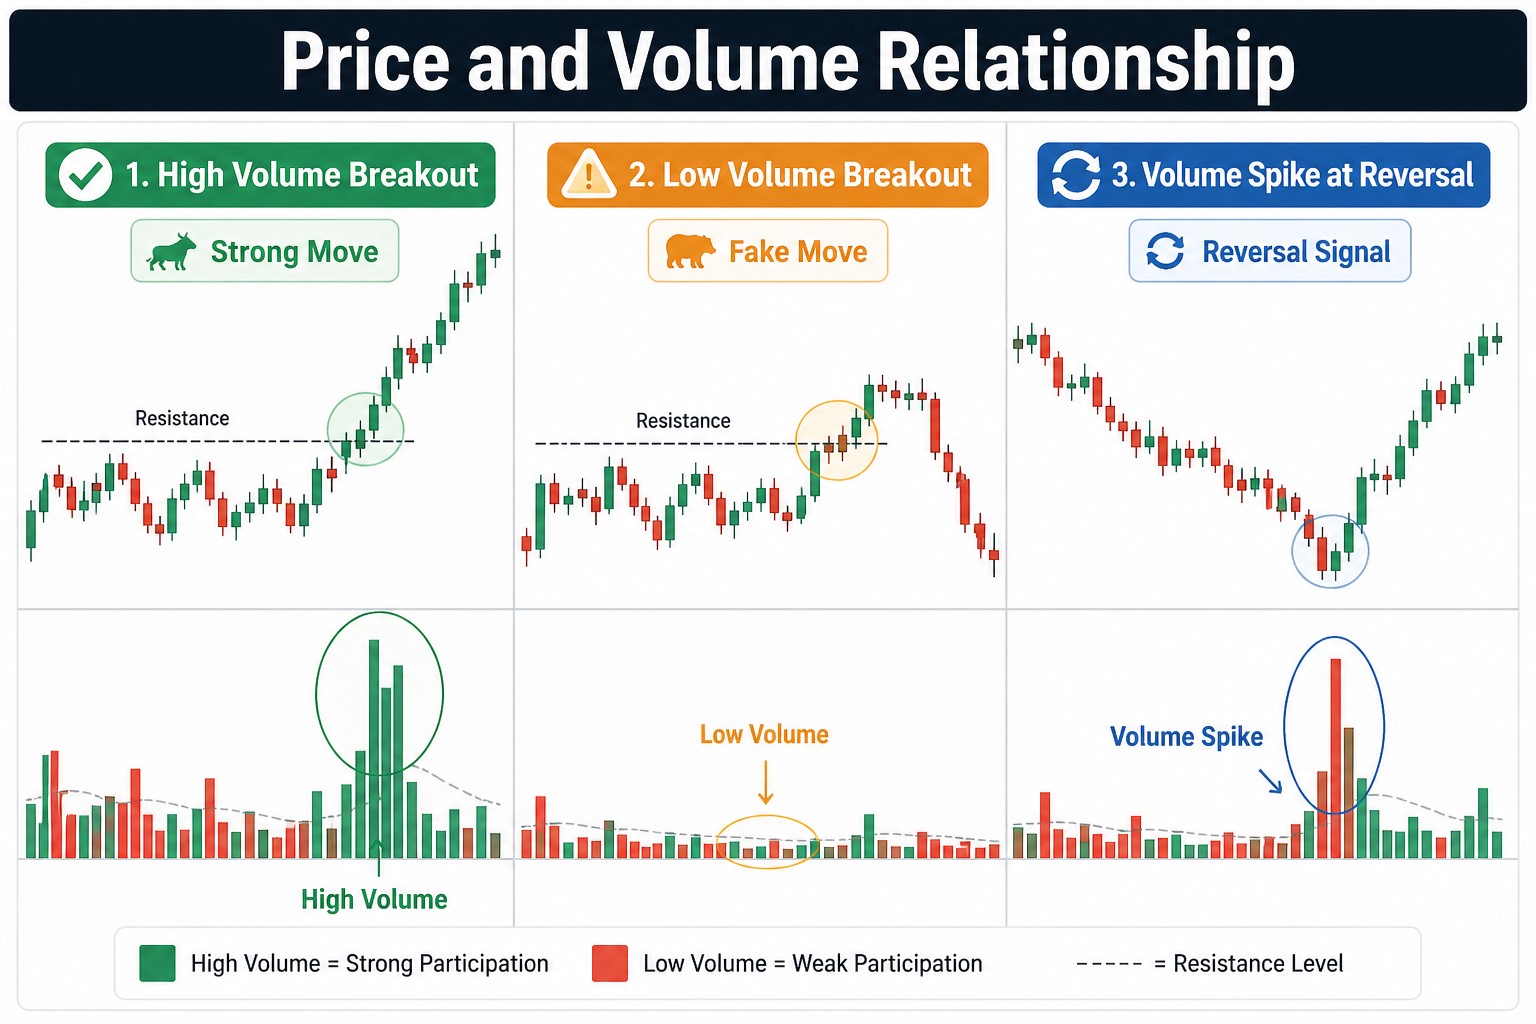
📈 3. Price and Volume Relationship (Core Concept)
To truly understand how to read volume in stock trading, you must combine it with price action. If you haven’t learned candlesticks yet, read this first: 👉 How to Read Candlestick Charts (Beginner Guide)
Now combine both:
✔ Breakout with High Volume
When price breaks resistance with strong volume, it means real buyers are entering the market.
👉 This is one of the most reliable bullish signals.
⚠ Rising Price with Low Volume
If price rises but volume is low, it often means the move lacks conviction.
👉 This is a common signal of a fake breakout.
🔄 Volume Spike at Reversal
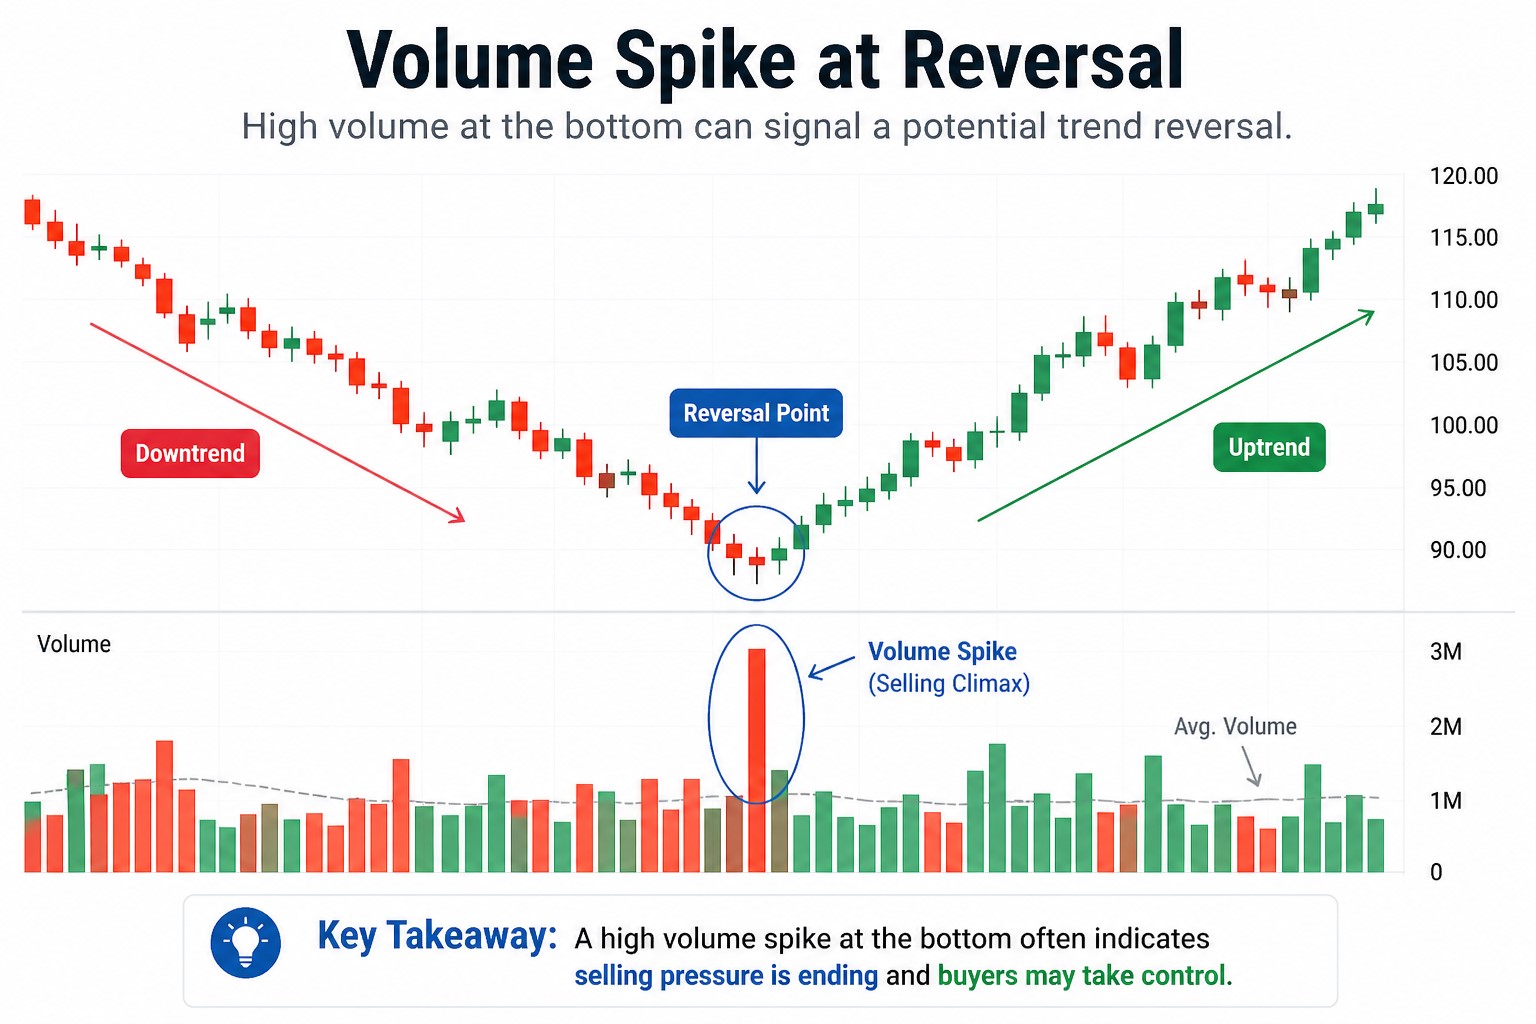
A sudden spike in volume after a long downtrend can signal that selling pressure is ending.
👉 This is often an early reversal signal.
⚠️ 4. Common Beginner Mistakes
❌ Ignoring Volume Completely
Many beginners only look at price charts. Without volume, you are missing half the information.
❌ Assuming High Volume Always Means “Buy”
High volume can also mean strong selling. Context matters (trend + price direction).
❌ Using Volume Alone
Volume should always be combined with other indicators. For a complete strategy, read:
👉 Best Indicators for Beginner Traders (Simple & Practical Guide)
🧠 How to Use Volume in Real Trading
Here’s a simple beginner-friendly approach:
- Identify the trend using price
- Check volume to confirm strength
- Avoid trades with low volume
- Look for volume spikes at key levels
You don’t need complex strategies.
Just understanding how to read volume in stock trading can significantly improve your decision-making.
🎯 Final Thoughts
Volume is one of the most powerful tools in trading.
While most beginners focus on price,
experienced traders watch volume first.
If you master how to read volume in stock trading,
you will start to see the difference between real moves and fake ones.
And that alone can change your results.
Learning how to read volume in stock trading
can completely change how you approach the market.
📌 Next Step
Now that you understand volume,
the next step is learning where price tends to react.
👉 Support and Resistance Explained (Beginner Guide to Better Entry Timing)
❓ FAQ
Q1. What is volume in stock trading?
Volume refers to the total number of shares traded during a specific period.
It shows how active the market is and helps traders understand the conviction behind a price move.
Q2. Why is volume important in trading?
It confirms whether a price movement is strong or weak.
High volume suggests strong participation, while low volume suggests a lack of interest.
Q3. How do you read volume with price?
Combine them together:
Price up + high volume = strong bullish signal
Price up + low volume = weak rally
Price down + high volume = strong selling pressure
Q4. Can volume predict stock price?
Not directly.
It confirms the strength of a move and helps traders avoid false signals like fake breakouts.
Q5. What is a volume spike?
A sudden, large increase in trading activity.
It often occurs during breakouts or reversals and signals strong interest from large market participants.
Q6. Is high volume always bullish?
No.
It can indicate strong buying or strong selling depending on whether price is moving up or down.
Q7. Should beginners use volume alone?
No.
It works best when combined with candlestick patterns and indicators like moving averages.
Q8. What is the best way to use volume as a beginner?
Keep it simple:
– Identify the trend
– Check volume for confirmation
– Avoid low-volume moves
– Watch for spikes at key support and resistance levels
🔍 Related Articles
To better understand and apply this moving average strategy, explore these guides:
📈 Trading Basics
⚠️ Disclaimer: This article is for educational purposes only and should not be considered financial advice. Please conduct your own research before making any investment decisions.