📌 TL;DR
A moving average helps you identify the trend and filter out market noise.
By learning how to use moving averages,
you can follow trends, find better entry points, and avoid trading against the market.
💡 Introduction
Moving average explained in simple terms is one of the most important concepts for beginner traders.
Many beginner traders struggle with one simple question:
What is a moving average, and how does it help identify trends?
Price moves constantly,
and it’s easy to get confused by short-term fluctuations.
That’s where the moving average comes in.
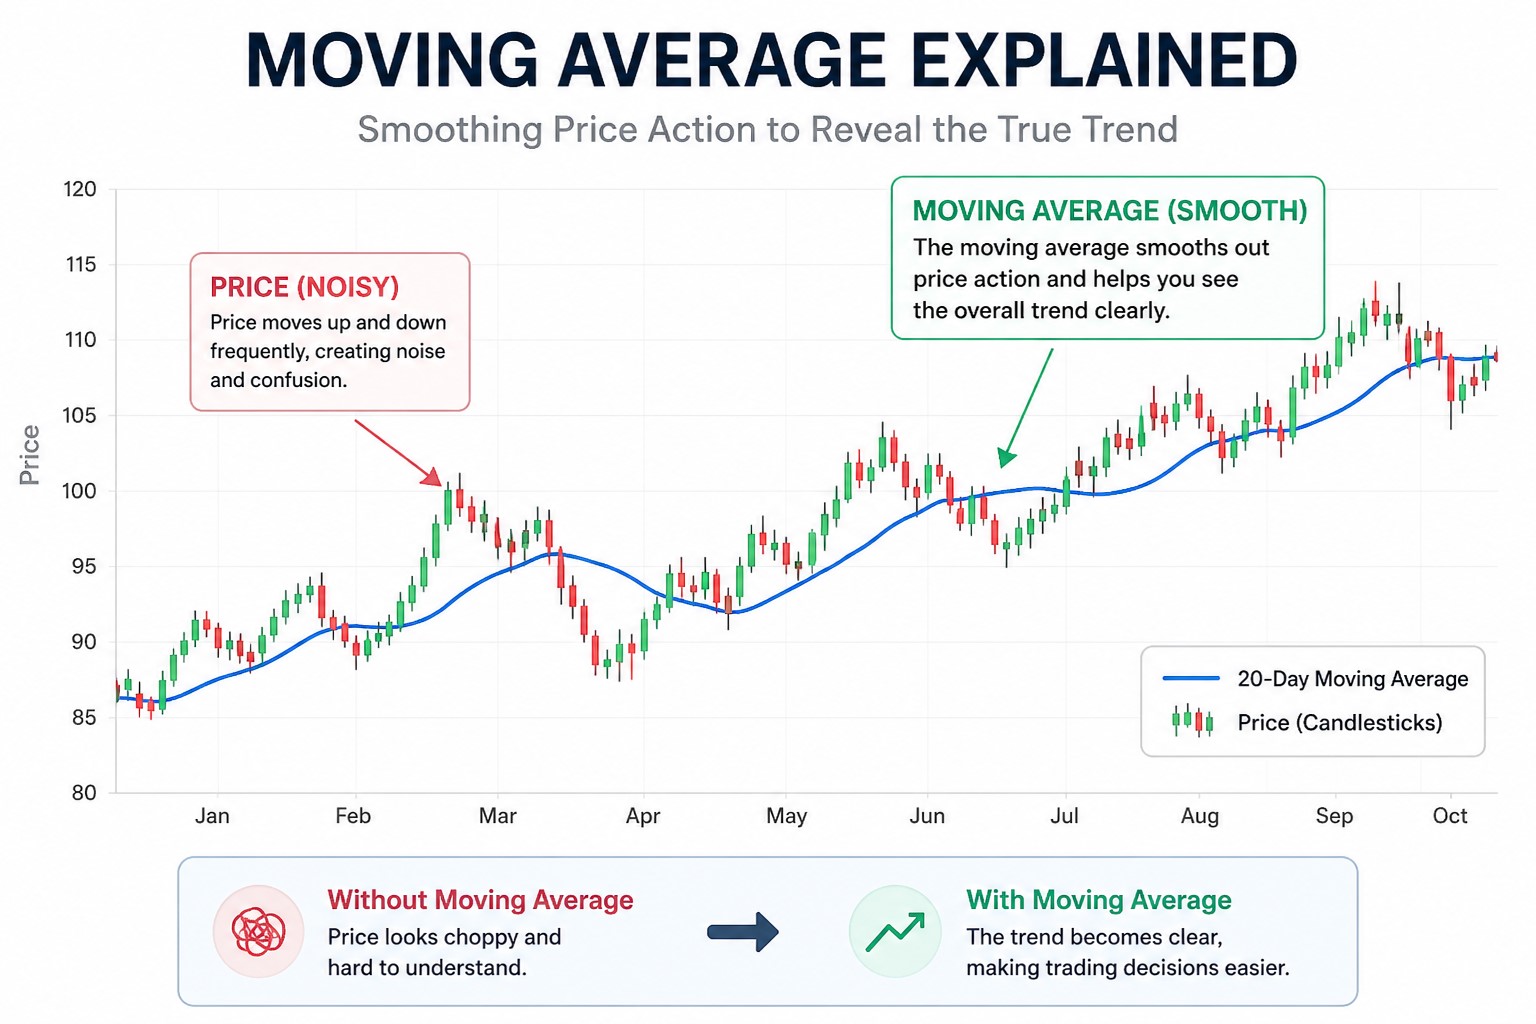
A moving average smooths out price action
and helps you clearly see the overall trend.
If you understand this concept,
you will stop guessing
and start trading with the trend.
For beginner traders, this is one of the most essential tools to understand before using any indicators in real trading.
📊 1. What Is a Moving Average?
A moving average is the average price of a stock
over a specific period of time.
For example:
- 20-day moving average = average price over the last 20 days
- 50-day moving average = average price over the last 50 days
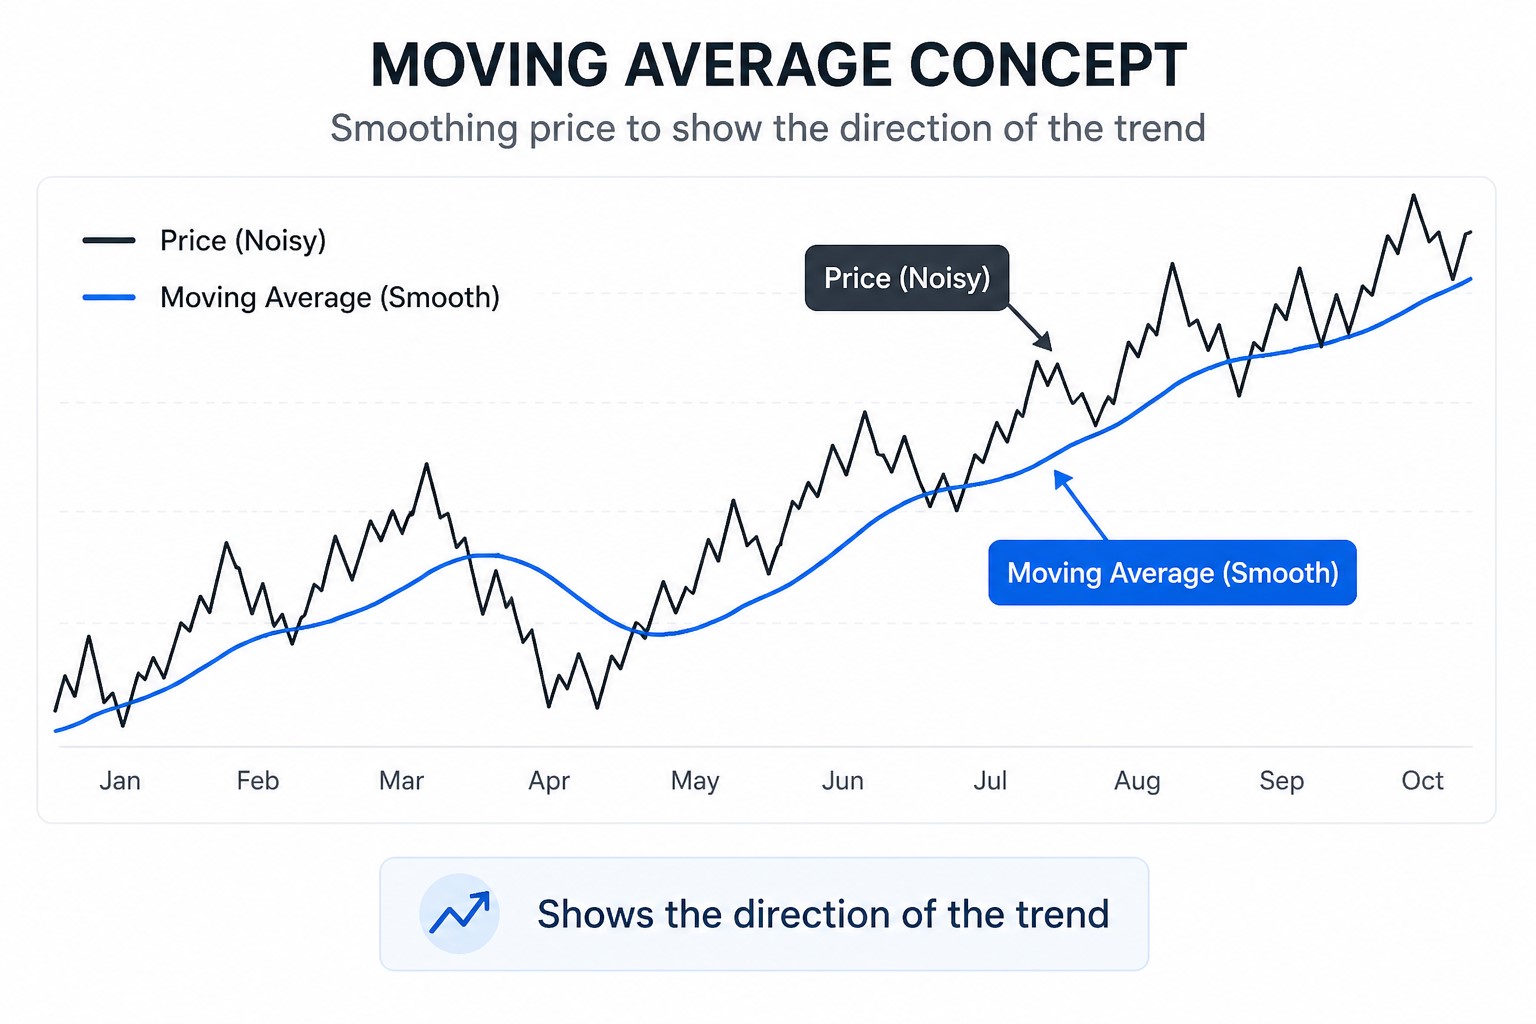
It is plotted as a line on the chart
and moves along with price.
👉 In simple terms,
it shows the direction of the trend.
For a deeper explanation, refer to Investopedia’s guide on moving averages.
🔥 2. Why Moving Averages Matter
Price alone can be noisy and confusing.
A moving average helps you:
- Identify the trend direction
- Filter out short-term noise
- Stay on the right side of the market
Here’s the key idea:
- Price above moving average → uptrend
- Price below moving average → downtrend
👉 This is one of the simplest and most powerful concepts in trading.
📈 3. Key Moving Average Signals
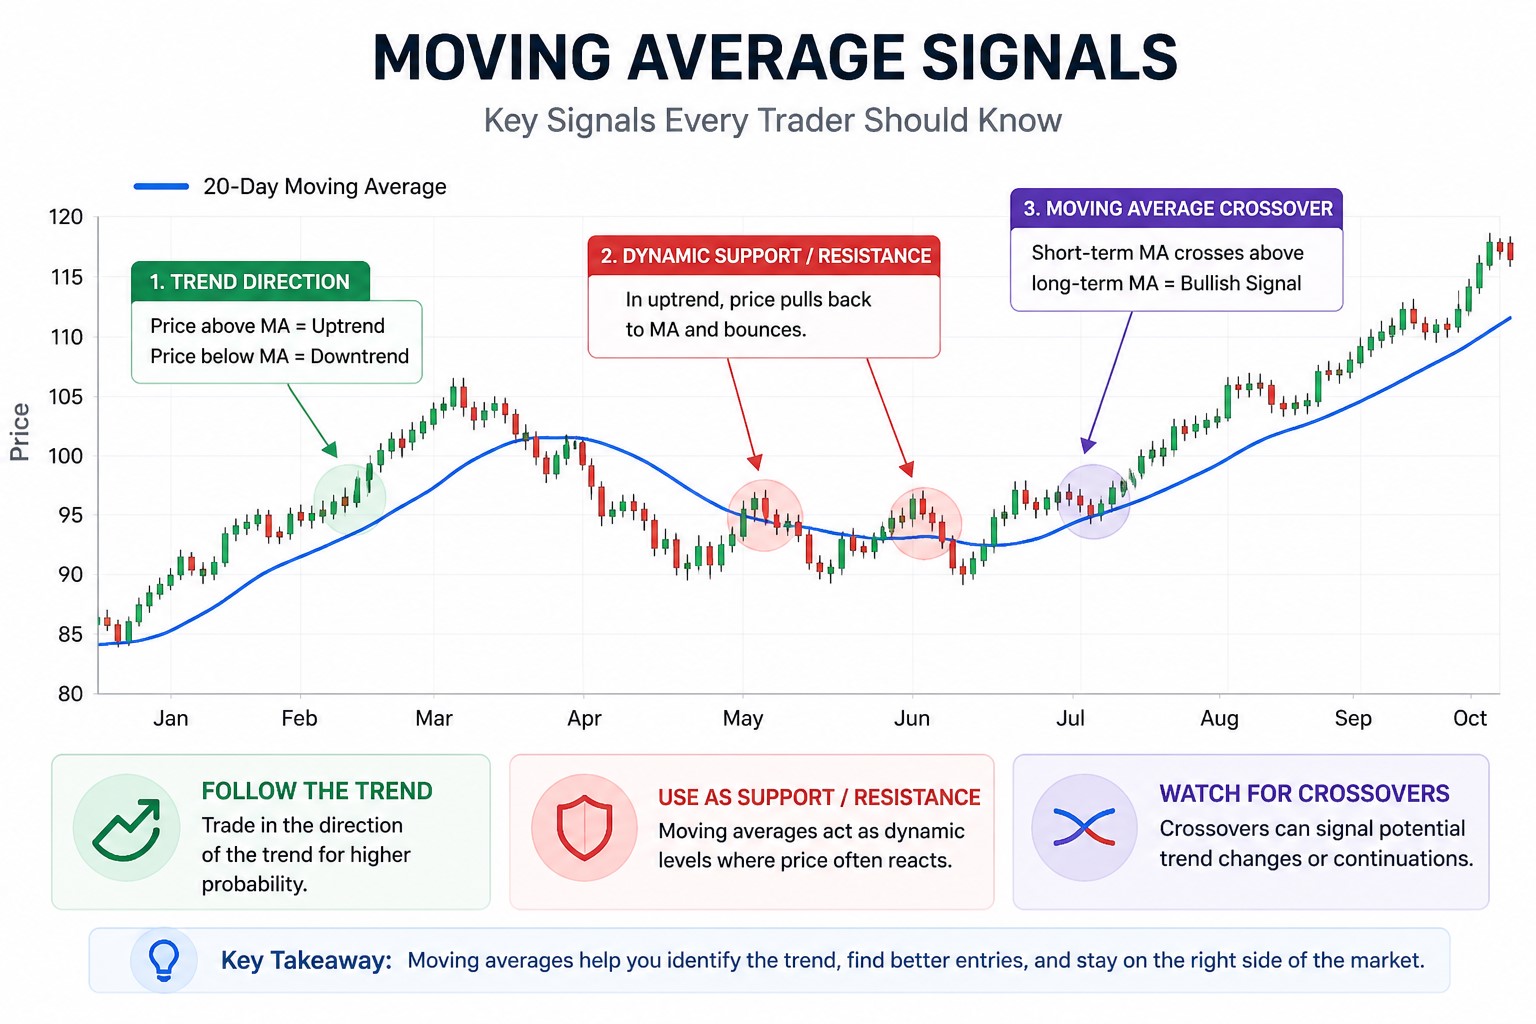
✔ 1. Trend Direction (Most Important)
The first and most important use
is identifying the trend.
- Price above MA → bullish trend
- Price below MA → bearish trend
👉 Always trade in the direction of the trend.
✔ 2. Dynamic Support and Resistance
Moving averages often act as support or resistance.
- In an uptrend → price pulls back to MA and bounces
- In a downtrend → price gets rejected at MA
👉 This is where many traders look for entry points.
✔ 3. Moving Average Crossover
A crossover happens when two moving averages intersect.
Example:
- Short-term MA crosses above long-term MA → bullish signal
- Short-term MA crosses below long-term MA → bearish signal
👉 This is often used as a trend change signal.
This is the core idea behind moving average explained in trading.
⚠️ 4. Common Beginner Mistakes
❌ Using Too Many Moving Averages
Too many lines create confusion.
👉 Stick to 1–2 key averages (20, 50, 200)
❌ Trading Against the Trend
Trying to predict reversals too early
is one of the biggest mistakes.
👉 Follow the trend first.
❌ Ignoring Volume
Moving averages show trend,
but they don’t show strength.
For better confirmation, read:
👉 How to Read Volume in Stock Trading (Beginner Guide)
🧠 How to Use Volume in Real Trading
If you’re not familiar with candlestick charts, start here:
👉 How to Read Candlestick Charts (Beginner Guide)
Here’s a simple beginner-friendly strategy:
- Identify the trend using a moving average
- Wait for price to pull back
- Look for confirmation (volume, candlestick)
- Enter in the direction of the trend
You don’t need complicated systems.
Once you understand moving average explained concepts,
you can apply them in real trading situations.
🎯 Final Thoughts
A moving average explained in simple terms is not just a line on a chart.
It is a tool that helps you
understand the direction of the market.
If you follow the trend
instead of fighting it,
your trading decisions
will become much clearer and more consistent.
Learning moving average explained concepts
can completely change how you approach the market.
📌 Next Step
Now that you understand how moving averages work,
the next step is learning how to read price action.
❓ FAQ
Q1. What is a moving average explained in trading?
A moving average is the average price of an asset over a specific time period.
It helps traders identify trends and smooth out price fluctuations.
Q2. Which moving average is best for beginners?
The most common ones are 20-day, 50-day, and 200-day moving averages.
These are widely used and easy to understand.
Q3. Is a moving average a lagging indicator?
Yes.
It is based on past price data, so it reacts after the trend has started.
Q4. Can moving averages predict price?
No.
They do not predict future prices, but they help identify trends.
Q5. What is a moving average crossover?
It occurs when a short-term moving average crosses a long-term one,
often signaling a potential trend change.
🔍 Related Articles
To better understand this topic, it helps to explore related concepts such as:
📊 Market Fundamentals
⚠️ Disclaimer: This article is for educational purposes only and should not be considered financial advice. Please conduct your own research before making any investment decisions.