📌 TL;DR
RSI (Relative Strength Index) is a key momentum indicator used to identify overbought and oversold conditions.
Understanding RSI explained concepts and RSI indicator strategy helps you:
- Improve your entry timing
- Avoid emotional trading decisions
For the best results, always combine RSI with trend, volume, and support and resistance.
💡 Introduction
What is RSI explained, and how does the RSI indicator work in real trading?
Understanding RSI explained concepts is essential for traders who want to improve timing and avoid emotional decisions.
Many beginner traders struggle not with direction, but with timing.
They understand the trend, yet still enter too late or exit too early.
This is where the RSI indicator becomes essential.
The RSI indicator helps traders determine whether price is overbought or oversold,
allowing for more precise entries and exits.
If you fully understand RSI explained concepts,
you can move from emotional trading to structured decision-making.
📊 1. RSI Indicator Explained: What Is RSI?
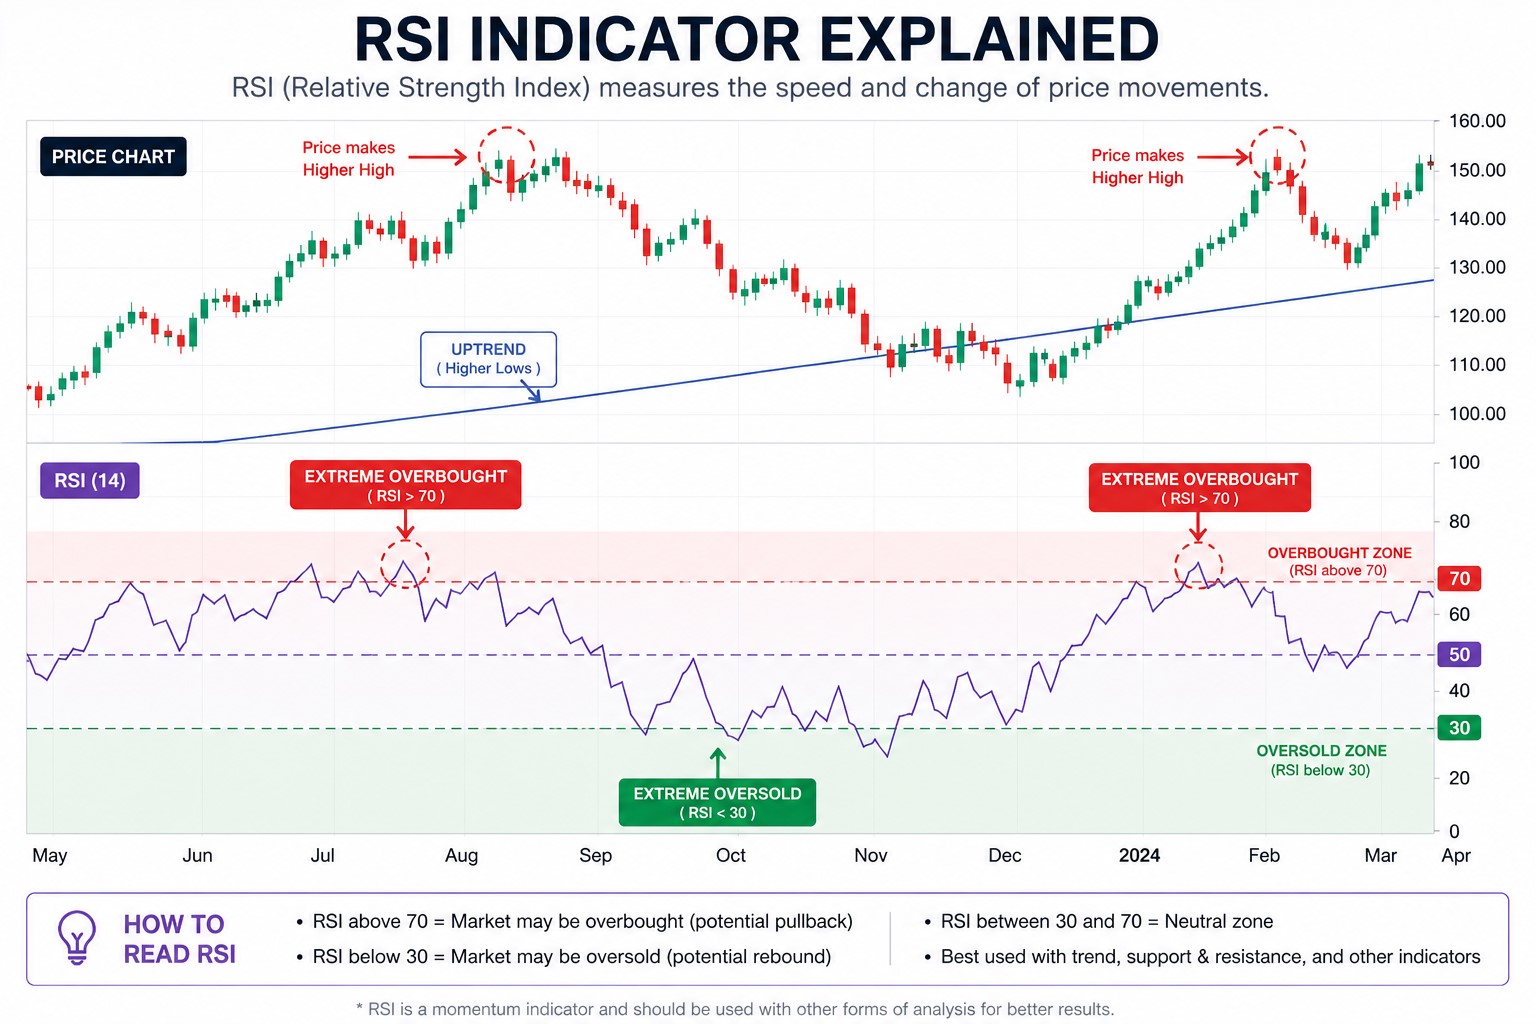
RSI (Relative Strength Index) is a momentum oscillator that measures the strength and speed of price movements.
To fully understand RSI explained concepts, you can read a detailed explanation of RSI (Relative Strength Index) on Investopedia.
Here, RS (Relative Strength) is calculated as:
- Average gain over a period
- divided by average loss over the same period
The default setting is RSI 14,
which is widely used across stocks, crypto, and forex markets.
The RSI indicator ranges between 0 and 100:
- RSI above 70 → Overbought
- RSI below 30 → Oversold
This is the foundation of RSI explained and RSI indicator usage.
📉 2. RSI Overbought and Oversold Zones
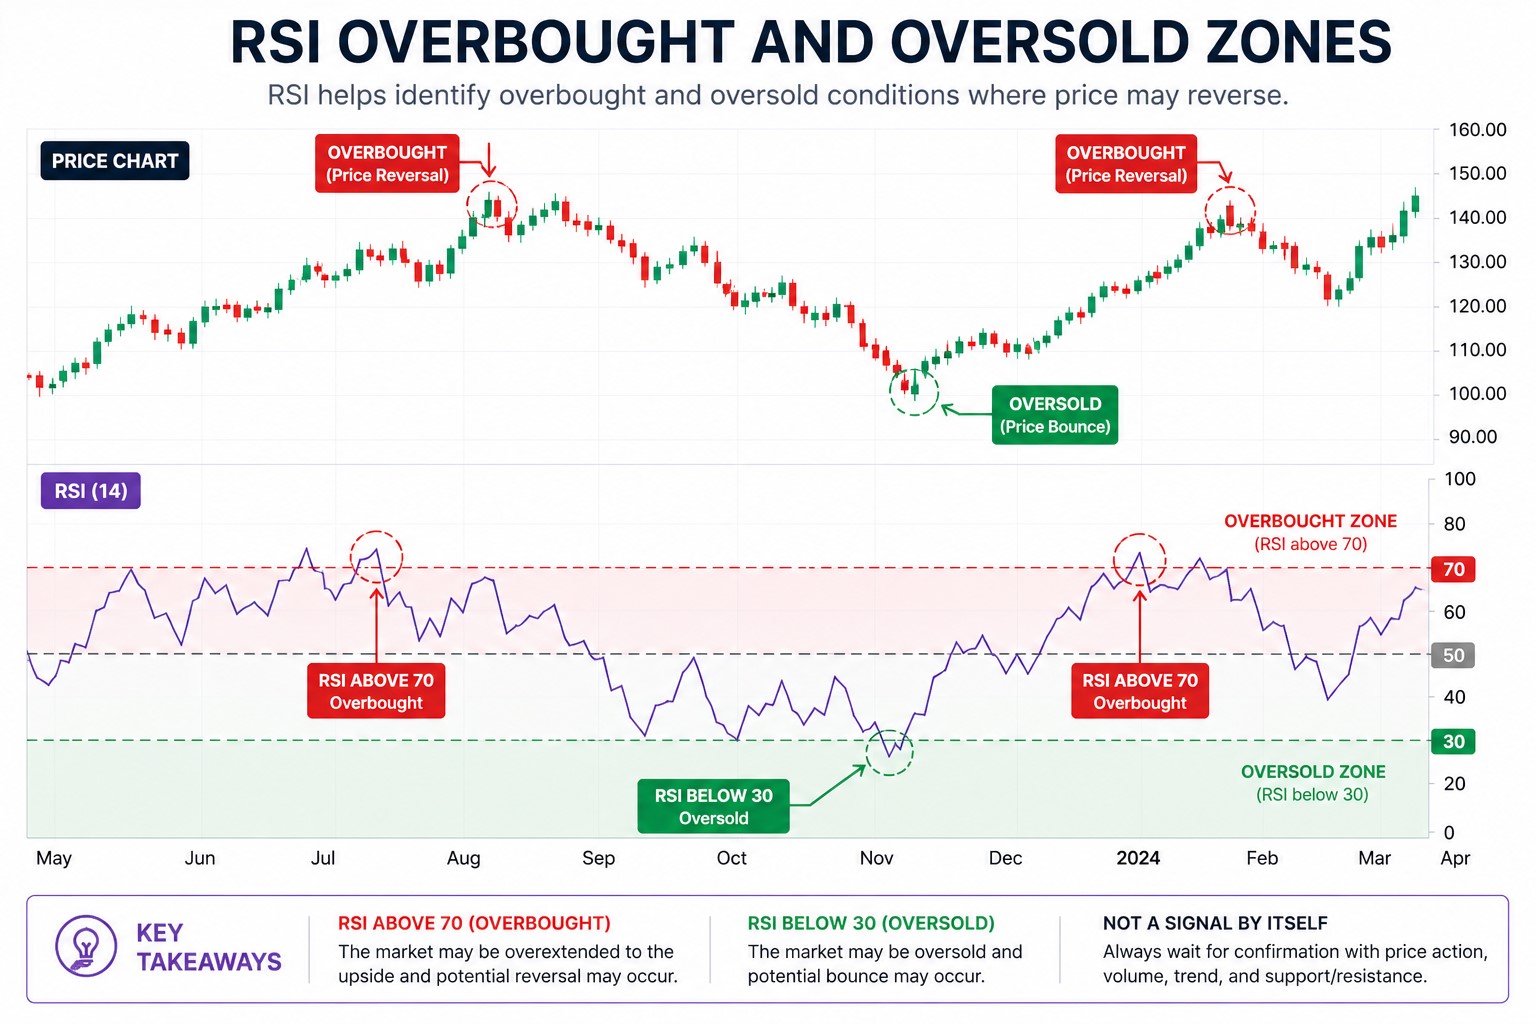
Understanding overbought and oversold levels is essential for using the RSI indicator effectively.
When RSI rises above 70, it suggests the market may be overextended to the upside.
When RSI falls below 30, it indicates potential exhaustion on the downside.
However, a key point in RSI explained:
Overbought does not mean immediate sell,
and oversold does not mean immediate buy.
In strong trends, RSI can remain in these zones longer than expected.
⚠️ 3. RSI Indicator Strategy: The Biggest Mistake
One of the biggest mistakes in RSI indicator strategy is using it as a direct signal.
Many traders assume:
- RSI > 70 → Sell
- RSI < 30 → Buy
This simplistic approach often leads to losses.
Instead, RSI should be used as a context tool, not a trigger.
The correct RSI indicator usage is:
Identify extreme conditions
Wait for confirmation
Enter with supporting signals
🧠 4. How to Use RSI in Real Trading
A practical RSI indicator strategy combines multiple elements.
First, identify the trend using a moving average.
👉 Moving Average Explained
Next, wait for a pullback within that trend.
Then use RSI to refine your entry timing.
- In an uptrend → RSI near 30
- In a downtrend → RSI near 70
Finally, confirm with:
- Candlestick patterns
👉 How to Read Candlestick Charts - Volume
👉 How to Read Volume in Stock Trading - Support and resistance
👉 Support and Resistance Explained
This combination significantly improves accuracy.
🔥 5. RSI Divergence (Advanced Concept)
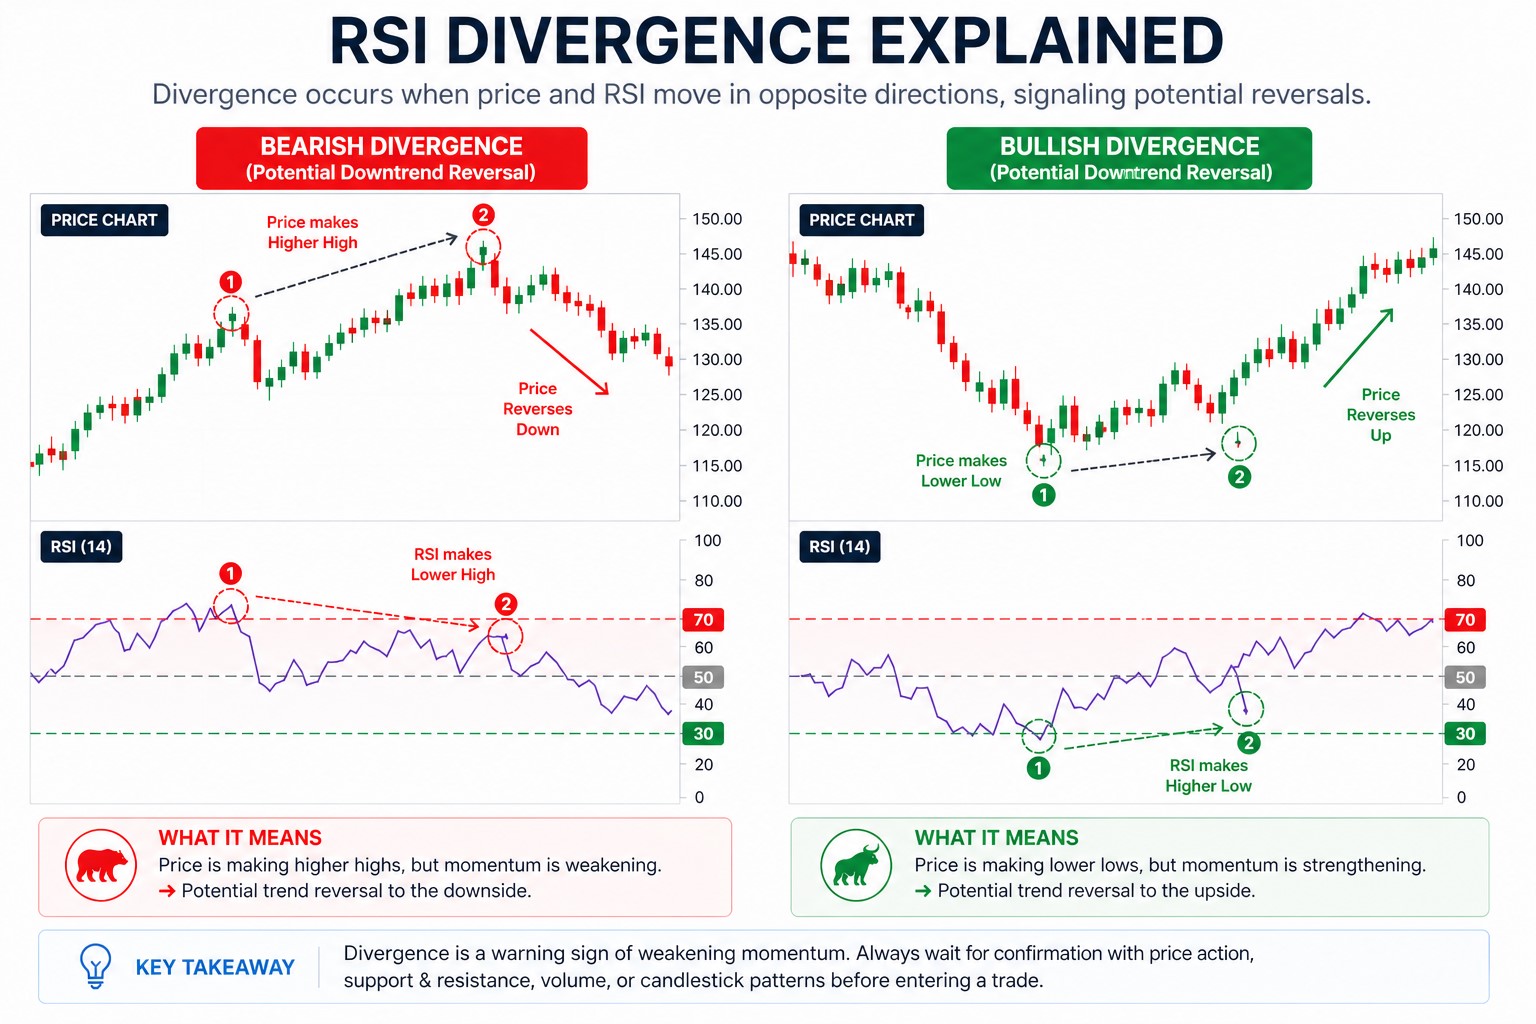
RSI divergence is one of the most powerful RSI explained concepts.
It occurs when price and RSI move in opposite directions.
Example:
- Price makes a higher high
- RSI makes a lower high
This is bearish divergence and signals weakening momentum.
Similarly:
- Price makes a lower low
- RSI makes a higher low
This is bullish divergence.
👉 Alt text example:
“RSI divergence example showing price making higher high while RSI weakens”
You can observe RSI divergence in real-time charts using TradingView.
📊 6. RSI in Trending Markets (Real Trading Tip)
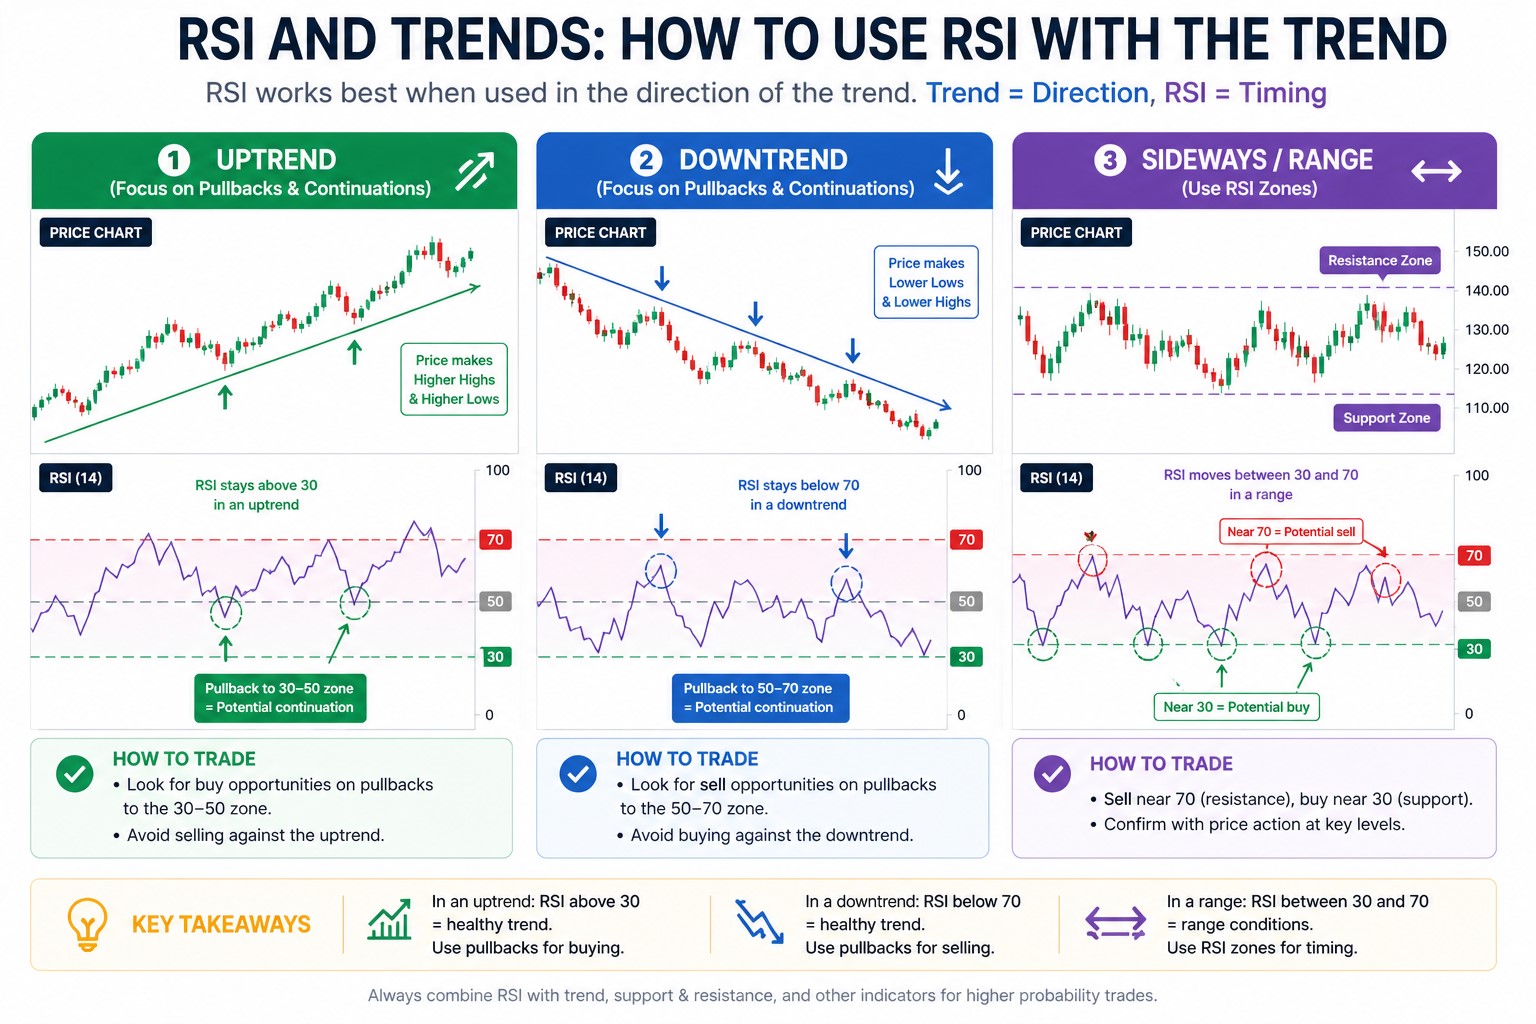
A key insight often missed by beginners:
RSI behaves differently depending on market conditions.
Market conditions are often influenced by monetary policy and interest rates.
For example, central bank policy from the Federal Reserve plays a key role.
In a strong uptrend:
- RSI may not drop to 30
- It often finds support near 40
In a strong downtrend:
- RSI may not reach 70
- It often faces resistance near 60
This adjustment is crucial for real trading.
👉 Alt text example:
“RSI trend behavior showing support at 40 in uptrend and resistance at 60 in downtrend”
⚡ 7. RSI Failure Swing (Hidden Signal)
Another advanced RSI indicator concept is the Failure Swing.
This occurs when RSI fails to break a previous high or low.
Example:
- RSI enters overbought zone
- Fails to make a higher high
- Then drops
This is a strong reversal signal.
Failure swings often appear before major moves,
making them valuable for advanced traders.
⚡ 8. RSI vs Moving Average
| Indicator | Purpose |
|---|---|
| Moving Average | Trend direction |
| RSI | Entry timing |
Moving averages define the trend,
while RSI refines entry points.
Using both together creates a balanced trading system.
📊 9. Best RSI Settings
The standard RSI setting is 14 periods.
Some variations include:
- RSI 7 → more sensitive (short-term)
- RSI 21 → smoother (long-term)
For most beginners, RSI 14 remains the best choice.
🎯 Final Thoughts
RSI is not a prediction tool.
It is a momentum analysis tool.
Used alone, it can be misleading.
Used correctly, it becomes extremely powerful.
By combining RSI with:
- Trend
- Volume
- Support and resistance
You create a structured and repeatable trading approach.
Mastering RSI explained concepts is one of the fastest ways
to improve your trading performance.
📌 Next Step
Now that you understand RSI explained and RSI indicator strategy,
the next step is combining multiple indicators.
👉 Best Moving Average Strategy for Beginners (Step-by-Step Guide)
❓ FAQ
Q1. What is RSI in simple terms?
RSI is a momentum indicator that shows whether a market is overbought or oversold.
Q2. What is the best RSI strategy?
The best RSI indicator strategy combines trend, RSI levels, and confirmation signals.
Q3. Can RSI be used alone?
No. RSI should always be combined with other indicators.
Q4. What is RSI divergence?
RSI divergence occurs when price and RSI move differently, signaling potential reversals.
🔍 Related Articles
To better understand this topic, it helps to explore related concepts such as:
📈 Trading Basics
⚠️ Disclaimer: This article is for educational purposes only and should not be considered financial advice. Please conduct your own research before making any investment decisions.